Grunnleggende statistikk
| Institusjonelle eiere | 171 total, 168 long only, 1 short only, 2 long/short - change of −0,89% MRQ |
| Gjennomsnittlig porteføljeallokering | 0.0690 % - change of −20,55% MRQ |
| Institusjonelle aksjer (Long) | 45 771 478 (ex 13D/G) - change of −2,53MM shares −8,18% MRQ |
| Institusjonell verdi (Long) | $ 274 205 USD ($1000) |
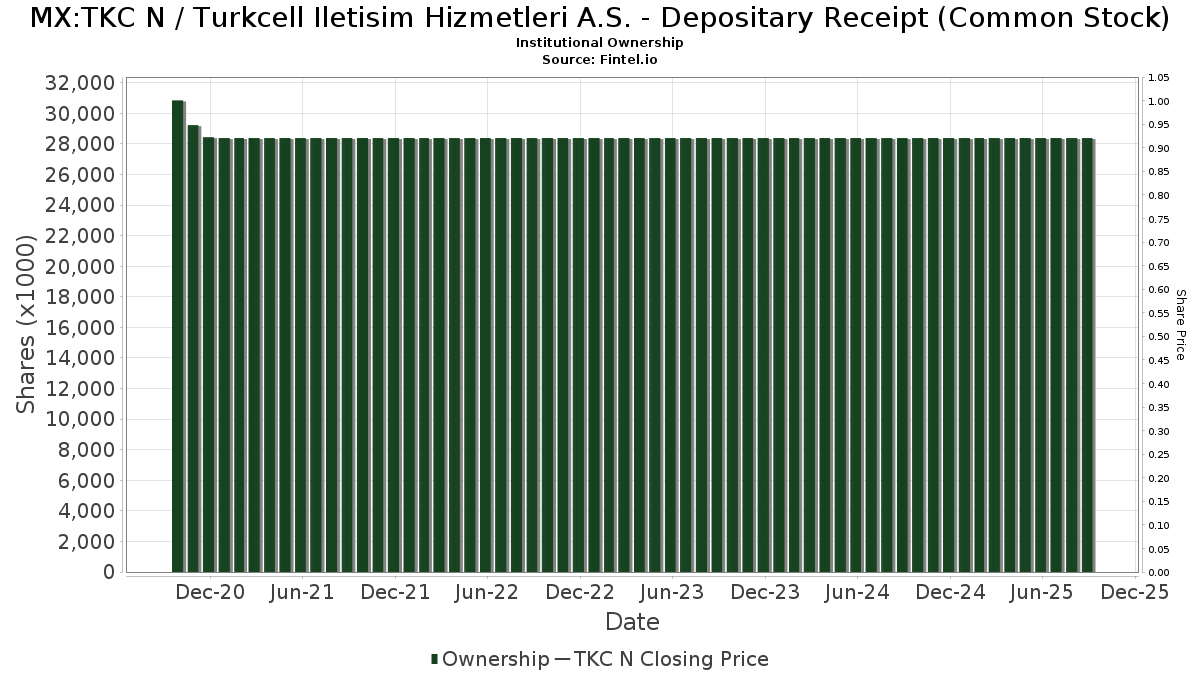
Institusjonelt eierskap og aksjonærer
Turkcell Iletisim Hizmetleri A.S. - Depositary Receipt (Common Stock) (MX:TKC N) har 171 institusjonelle eiere og aksjonærer som har sendt inn 13D/G- eller 13F-skjemaer til Securities Exchange Commission (SEC). Disse institusjonene eier til sammen 45,771,854 aksjer. De største aksjonærene inkluderer Morgan Stanley, Macquarie Group Ltd, DEMAX - Delaware Emerging Markets Fund Class A, BlackRock, Inc., Arrowstreet Capital, Limited Partnership, Marshall Wace, Llp, Goldman Sachs Group Inc, American Century Companies Inc, Two Sigma Investments, Lp, and Discovery Capital Management, Llc / Ct .
Turkcell Iletisim Hizmetleri A.S. - Depositary Receipt (Common Stock) (BMV:TKC N) institusjonell eierstruktur viser nåværende posisjoner i selskapet fordelt på institusjoner og fond, samt de siste endringene i posisjonsstørrelse. De største aksjonærene kan være individuelle investorer, verdipapirfond, hedgefond eller institusjoner. Schedule 13D indikerer at investoren eier (eller har eid) mer enn 5 % av selskapet og har til hensikt (eller hadde til hensikt) å aktivt forfølge en endring i forretningsstrategien. Schedule 13G indikerer en passiv investering på over 5 %.
Fondssentiment-score
Fondssentiment Score (også kjent som akkumulering av eierskap poengsum) viser hvilke aksjer som er mest kjøpt av fond. Den er resultatet av en sofistikert, kvantitativ flerfaktormodell som identifiserer selskaper med de høyeste nivåene av institusjonell akkumulering. Beregningsmodellen for poeng bruker en kombinasjon av den totale økningen i antall offentliggjorte eiere, endringer i porteføljeallokeringen til disse eierne og andre beregninger. Tallet går fra 0 til 100, der høyere tall indikerer en høyere grad av akkumulering i forhold til sammenlignbare selskaper, der 50 er gjennomsnittet.
Oppdateringsfrekvens: Daglig
Sjekk ut Ownership Explorer, som inneholder en liste over de høyest rangerte selskapene.
13F- og NPORT-arkiveringer
Detaljer om 13F-arkiveringer er gratis. Detaljer om NP-arkiveringer krever et premium-medlemskap. Grønne rader indikerer nye posisjoner. Røde rader indikerer lukkede posisjoner. Klikk på lenke ikonet for å se hele transaksjonshistorikken.
Oppgrader
for å låse opp premiedata og eksportere til Excel. ![]() .
.
| Fildato | Kilde | Investor | Type | Gjennomsnittlig pris (estimert) |
Aksjer | Δ Aksjer (%) |
Rapportert verdi ($1000) | Verdi (%) | Portallokering (%) | |
|---|---|---|---|---|---|---|---|---|---|---|
| 2025-08-11 | 13F | Frank, Rimerman Advisors LLC | 27 401 | 166 | ||||||
| 2025-07-28 | NP | AVES - Avantis Emerging Markets Value ETF This fund is a listed as child fund of American Century Companies Inc and if that institution has disclosed ownership in this security, then these positions will not be double counted when calculating total shares and total value | 108 676 | 120,69 | 661 | 98,20 | ||||
| 2025-08-08 | 13F | Creative Planning | 240 117 | −6,96 | 1 453 | −9,53 | ||||
| 2025-08-14 | 13F | Bank Of America Corp /de/ | 53 322 | −35,42 | 323 | −37,23 | ||||
| 2025-08-06 | 13F | Savant Capital, LLC | 15 843 | −34,38 | 96 | −36,67 | ||||
| 2025-08-12 | 13F | O'shaughnessy Asset Management, Llc | 675 177 | −7,91 | 4 085 | −10,44 | ||||
| 2025-08-14 | 13F | Wetherby Asset Management Inc | 88 252 | −7,78 | 534 | −14,31 | ||||
| 2025-05-14 | 13F | Walleye Capital LLC | 0 | −100,00 | 0 | |||||
| 2025-08-14 | 13F | Millennium Management Llc | 819 710 | 153,29 | 4 959 | 146,47 | ||||
| 2025-08-14 | 13F | UBS Group AG | 10 524 | −42,02 | 64 | −43,75 | ||||
| 2025-08-28 | NP | NDOW - Anydrus Advantage ETF | 6 935 | 42 | ||||||
| 2025-05-08 | NP | QGBLX - Quantified Global Fund Investor Class | 24 880 | 155 | ||||||
| 2025-05-15 | 13F | CAPROCK Group, Inc. | 84 668 | −0,56 | 527 | −5,05 | ||||
| 2025-08-13 | 13F | Jones Financial Companies Lllp | 0 | −100,00 | 0 | |||||
| 2025-08-14 | 13F/A | Barclays Plc | 60 108 | 0,00 | 0 | |||||
| 2025-08-14 | 13F | Verition Fund Management LLC | 80 689 | 488 | ||||||
| 2025-08-14 | 13F | Vident Advisory, LLC | 334 622 | 1,91 | 2 024 | −0,88 | ||||
| 2025-08-12 | 13F | Coldstream Capital Management Inc | 0 | −100,00 | 0 | |||||
| 2025-08-14 | 13F | Smartleaf Asset Management LLC | 0 | −100,00 | 0 | |||||
| 2025-08-12 | 13F | Atlas Capital Advisors Llc | 546 | −98,86 | 3 | −98,99 | ||||
| 2025-08-14 | 13F | Aprio Wealth Management, LLC | 14 379 | −38,30 | 87 | −40,28 | ||||
| 2025-08-12 | 13F | CIBC Private Wealth Group, LLC | 8 166 | 4,03 | 49 | 8,89 | ||||
| 2025-08-12 | 13F | Global Retirement Partners, LLC | 418 | −20,08 | 3 | −33,33 | ||||
| 2025-05-12 | 13F | Simplex Trading, Llc | 0 | −100,00 | 0 | |||||
| 2025-08-13 | 13F | Renaissance Technologies Llc | 364 900 | 2 208 | ||||||
| 2025-08-14 | 13F | TCG Advisory Services, LLC | 0 | −100,00 | 0 | |||||
| 2025-08-11 | 13F | Integrated Quantitative Investments LLC | 72 057 | 436 | ||||||
| 2025-05-05 | 13F | Lindbrook Capital, Llc | 10 384 | 4,88 | 65 | 0,00 | ||||
| 2025-08-07 | 13F | Vise Technologies, Inc. | 500 209 | 26,42 | 3 026 | 17,51 | ||||
| 2025-07-25 | 13F | Cwm, Llc | 12 322 | −6,93 | 0 | |||||
| 2025-08-04 | 13F | Assetmark, Inc | 61 | −79,67 | 0 | −100,00 | ||||
| 2025-07-24 | 13F | IFP Advisors, Inc | 120 | 0,00 | 1 | |||||
| 2025-08-14 | 13F | Citadel Advisors Llc | 157 003 | 2,87 | 950 | 0,00 | ||||
| 2025-08-12 | 13F | Pathstone Holdings, LLC | 95 837 | 2,21 | 581 | −0,51 | ||||
| 2025-08-11 | 13F | Bell Investment Advisors, Inc | 988 | 0,00 | 6 | −16,67 | ||||
| 2025-08-14 | 13F | Glenmede Investment Management, LP | 11 761 | 71 | ||||||
| 2025-08-14 | 13F | Group One Trading, L.p. | Put | 2 900 | 18 | |||||
| 2025-08-14 | 13F | Group One Trading, L.p. | Call | 2 600 | 23,81 | 16 | 15,38 | |||
| 2025-07-21 | 13F | Credential Qtrade Securities Inc. | 0 | −100,00 | 0 | |||||
| 2025-08-13 | 13F | Gabelli Funds Llc | 405 500 | −0,12 | 2 453 | −2,85 | ||||
| 2025-08-14 | 13F | Syon Capital Llc | 15 795 | 96 | ||||||
| 2025-08-12 | 13F | American Century Companies Inc | 1 049 023 | 24,39 | 6 347 | 20,99 | ||||
| 2025-07-28 | NP | AVEEX - Avantis Emerging Markets Equity Fund Institutional Class This fund is a listed as child fund of American Century Companies Inc and if that institution has disclosed ownership in this security, then these positions will not be double counted when calculating total shares and total value | 43 376 | 8,59 | 264 | −2,59 | ||||
| 2025-08-13 | 13F | Hsbc Holdings Plc | 29 556 | −52,26 | 179 | −54,12 | ||||
| 2025-09-02 | 13F | Investors Towarzystwo Funduszy Inwestycyjnych Spolka Akcyjna | 0 | −100,00 | 0 | −100,00 | ||||
| 2025-08-07 | 13F | Parkside Financial Bank & Trust | 398 | −62,91 | 2 | −66,67 | ||||
| 2025-05-12 | 13F | Peapack Gladstone Financial Corp | 0 | −100,00 | 0 | |||||
| 2025-08-08 | 13F | KBC Group NV | 35 111 | 0,00 | 0 | |||||
| 2025-08-05 | 13F | Simplex Trading, Llc | Put | 4 400 | 10,00 | 0 | ||||
| 2025-08-11 | 13F | Pinnacle Wealth Planning Services, Inc. | 13 467 | −21,54 | 81 | −23,58 | ||||
| 2025-08-05 | 13F | Simplex Trading, Llc | Call | 100 | 0 | |||||
| 2025-08-12 | 13F | Proequities, Inc. | Put | 0 | 0 | |||||
| 2025-08-12 | 13F | Proequities, Inc. | Call | 0 | 0 | |||||
| 2025-08-12 | 13F | Proequities, Inc. | 0 | 0 | ||||||
| 2025-07-25 | 13F | JustInvest LLC | 129 670 | 1,52 | 785 | −1,26 | ||||
| 2025-07-17 | 13F | HB Wealth Management, LLC | 10 992 | 67 | ||||||
| 2025-07-14 | 13F | Abound Wealth Management | 78 | 11,43 | 0 | |||||
| 2025-08-12 | 13F | MAI Capital Management | 8 807 | 53 | ||||||
| 2025-08-29 | NP | Gabelli Multimedia Trust Inc. | 30 000 | 0,00 | 182 | −2,69 | ||||
| 2025-08-12 | 13F | Legal & General Group Plc | 10 317 | 0,00 | 62 | −3,12 | ||||
| 2025-08-14 | 13F | Royal Bank Of Canada | 20 104 | 3 477,22 | 122 | 2 950,00 | ||||
| 2025-08-11 | 13F | Lsv Asset Management | 102 400 | 0,00 | 1 | |||||
| 2025-08-04 | 13F | Hantz Financial Services, Inc. | 2 292 | 1 046,00 | 0 | |||||
| 2025-08-13 | 13F | Arrowstreet Capital, Limited Partnership | 2 601 742 | 37,70 | 15 741 | 33,93 | ||||
| 2025-08-14 | 13F | Modern Wealth Management, LLC | 20 726 | −43,85 | 125 | −45,41 | ||||
| 2025-08-12 | 13F | XTX Topco Ltd | 145 416 | 880 | ||||||
| 2025-07-25 | 13F | Sequoia Financial Advisors, LLC | 70 326 | 27,94 | 425 | 24,63 | ||||
| 2025-08-27 | NP | TIFF INVESTMENT PROGRAM - TIFF Multi-Asset Fund | Short | −376 | −2 | |||||
| 2025-07-28 | NP | AVEM - Avantis Emerging Markets Equity ETF This fund is a listed as child fund of American Century Companies Inc and if that institution has disclosed ownership in this security, then these positions will not be double counted when calculating total shares and total value | 845 998 | 20,84 | 5 144 | 8,36 | ||||
| 2025-08-29 | NP | Gabelli Global Utility & Income Trust | 28 000 | 0,00 | 169 | −2,87 | ||||
| 2025-08-14 | 13F | Discovery Capital Management, Llc / Ct | 898 131 | −9,74 | 5 434 | −12,22 | ||||
| 2025-07-14 | 13F | GAMMA Investing LLC | 16 397 | 9,31 | 99 | 6,45 | ||||
| 2025-08-29 | NP | Gabelli Utility Trust | 60 000 | 0,00 | 363 | −2,68 | ||||
| 2025-04-30 | 13F | Nisa Investment Advisors, Llc | 0 | −100,00 | 0 | |||||
| 2025-08-14 | 13F | Mercer Global Advisors Inc /adv | 16 780 | −16,48 | 102 | −18,55 | ||||
| 2025-08-15 | 13F | CI Private Wealth, LLC | 192 180 | 80,74 | 1 163 | 75,79 | ||||
| 2025-08-12 | 13F | Virtu Financial LLC | 58 945 | 0 | ||||||
| 2025-07-28 | NP | AVSE - Avantis Responsible Emerging Markets Equity ETF | 8 438 | 13,23 | 51 | 2,00 | ||||
| 2025-07-14 | 13F | AdvisorNet Financial, Inc | 52 | 0,00 | 0 | |||||
| 2025-08-14 | 13F | Macquarie Group Ltd | 4 674 902 | 0,00 | 28 283 | −2,73 | ||||
| 2025-09-04 | 13F/A | Advisor Group Holdings, Inc. | 1 113 | −3,13 | 7 | −14,29 | ||||
| 2025-07-24 | 13F | PDS Planning, Inc | 34 924 | 2,95 | 211 | 0,00 | ||||
| 2025-08-12 | 13F | Jpmorgan Chase & Co | 7 829 | 102,51 | 47 | 95,83 | ||||
| 2025-08-11 | 13F | Inspire Advisors, LLC | 20 062 | 4,72 | 121 | 1,68 | ||||
| 2025-08-05 | 13F | Advisors Preferred, LLC | 0 | −100,00 | 0 | |||||
| 2025-08-14 | 13F | Aqr Capital Management Llc | 304 118 | −11,26 | 1 825 | −14,08 | ||||
| 2025-08-15 | 13F | Tower Research Capital LLC (TRC) | 427 | 3 | ||||||
| 2025-08-01 | 13F | Bessemer Group Inc | 46 920 | 0,86 | 0 | |||||
| 2025-08-14 | 13F | Jane Street Group, Llc | 0 | −100,00 | 0 | |||||
| 2025-08-13 | 13F | Twin Peaks Wealth Advisors, LLC | 90 | 1 | ||||||
| 2025-07-25 | 13F | Yousif Capital Management, Llc | 15 522 | 14,28 | 94 | 10,71 | ||||
| 2025-07-28 | NP | AVXC - Avantis Emerging Markets ex-China Equity ETF | 11 387 | 37,49 | 69 | 23,21 | ||||
| 2025-08-13 | 13F | CLARET ASSET MANAGEMENT Corp | 28 430 | 0,00 | 0 | |||||
| 2025-08-05 | 13F | NewSquare Capital LLC | 45 | −70,00 | 0 | |||||
| 2025-08-14 | 13F | Quantinno Capital Management LP | 161 838 | 82,65 | 979 | 77,68 | ||||
| 2025-05-06 | 13F | Venturi Wealth Management, LLC | 0 | −100,00 | 0 | |||||
| 2025-07-09 | 13F | Sivia Capital Partners, LLC | 15 347 | −19,63 | 93 | −22,03 | ||||
| 2025-07-21 | 13F | HighMark Wealth Management LLC | 310 | 0,00 | 2 | 0,00 | ||||
| 2025-07-30 | 13F | Cullen/frost Bankers, Inc. | 0 | −100,00 | 0 | |||||
| 2025-08-13 | 13F | Cerity Partners LLC | 176 080 | −11,47 | 1 066 | −13,82 | ||||
| 2025-08-12 | 13F | BlackRock, Inc. | 4 038 714 | 6,23 | 24 434 | 3,32 | ||||
| 2025-08-13 | 13F/A | StoneX Group Inc. | 0 | −100,00 | 0 | −100,00 | ||||
| 2025-08-12 | 13F | Discerene Group LP | 199 788 | 0,00 | 1 209 | −2,74 | ||||
| 2025-04-21 | 13F | Nelson, Van Denburg & Campbell Wealth Management Group, LLC | 0 | −100,00 | 0 | |||||
| 2025-08-08 | 13F | Larson Financial Group LLC | 50 | 0 | ||||||
| 2025-08-14 | 13F | Qube Research & Technologies Ltd | 543 971 | 72,71 | 3 291 | 67,99 | ||||
| 2025-08-12 | 13F | SRS Capital Advisors, Inc. | 1 239 | 7 | ||||||
| 2025-08-08 | 13F | D'Orazio & Associates, Inc. | 14 587 | −10,79 | 88 | −12,87 | ||||
| 2025-08-14 | 13F | Point72 Asset Management, L.P. | 197 500 | 185,82 | 1 195 | 178,32 | ||||
| 2025-08-12 | 13F | Segall Bryant & Hamill, Llc | 0 | −100,00 | 0 | |||||
| 2025-05-15 | 13F | WPG Advisers, LLC | 0 | −100,00 | 0 | |||||
| 2025-07-24 | 13F | Us Bancorp \de\ | 41 707 | 14,72 | 252 | 11,50 | ||||
| 2025-08-12 | 13F | Wayfinding Financial, LLC | 0 | −100,00 | 0 | |||||
| 2025-08-14 | 13F | Wells Fargo & Company/mn | 74 | −99,85 | 0 | −100,00 | ||||
| 2025-07-15 | 13F | Colonial River Wealth Management, LLC | 15 090 | 0,00 | 88 | −5,38 | ||||
| 2025-07-28 | NP | NSI - National Security Emerging Markets Index ETF | 5 723 | 38,47 | 35 | 21,43 | ||||
| 2025-08-14 | 13F | Raymond James Financial Inc | 756 | 5 | ||||||
| 2025-08-13 | 13F | West Family Investments, Inc. | 38 446 | 55,04 | 233 | 50,65 | ||||
| 2025-07-11 | 13F | BTC Capital Management, Inc. | 0 | −100,00 | 0 | |||||
| 2025-08-14 | 13F | Balyasny Asset Management Llc | 36 773 | 222 | ||||||
| 2025-05-27 | NP | RMEAX - Aspiriant Risk-Managed Equity Allocation Fund Advisor Shares | 40 219 | 0,00 | 250 | −4,21 | ||||
| 2025-08-11 | 13F | Principal Securities, Inc. | 167 | 65,35 | 1 | |||||
| 2025-07-16 | 13F | Signaturefd, Llc | 43 298 | −4,42 | 262 | −7,12 | ||||
| 2025-08-14 | 13F | Citadel Advisors Llc | Call | 0 | −100,00 | 0 | ||||
| 2025-07-28 | 13F | BRYN MAWR TRUST Co | 0 | −100,00 | 0 | |||||
| 2025-08-07 | 13F | Connor, Clark & Lunn Investment Management Ltd. | 45 955 | −17,41 | 278 | −19,65 | ||||
| 2025-08-13 | 13F | EverSource Wealth Advisors, LLC | 22 358 | 51,76 | 135 | 48,35 | ||||
| 2025-08-14 | 13F | Citadel Advisors Llc | Put | 0 | −100,00 | 0 | ||||
| 2025-08-15 | 13F | Morgan Stanley | 10 634 501 | 1,10 | 64 339 | −1,66 | ||||
| 2025-08-08 | 13F | JBF Capital, Inc. | 15 000 | 0,00 | 91 | −3,23 | ||||
| 2025-08-14 | 13F | Two Sigma Securities, Llc | 25 886 | 157 | ||||||
| 2025-07-14 | 13F | Foster Group, Inc. | 11 053 | 67 | ||||||
| 2025-08-29 | NP | MPLAX - Praxis International Index Fund Class A | 161 575 | 147,88 | 978 | 141,23 | ||||
| 2025-08-28 | NP | KOMP - SPDR S&P Kensho New Economies Composite ETF This fund is a listed as child fund of State Street Corp and if that institution has disclosed ownership in this security, then these positions will not be double counted when calculating total shares and total value | 707 146 | 4 278 | ||||||
| 2025-08-13 | 13F | Quadrant Capital Group Llc | 82 000 | −8,75 | 496 | −11,11 | ||||
| 2025-07-28 | NP | MAKX - ProShares S&P Kensho Smart Factories ETF | 5 848 | −8,61 | 36 | −18,60 | ||||
| 2025-07-15 | 13F | Ballentine Partners, LLC | 72 883 | −0,51 | 441 | −3,30 | ||||
| 2025-07-21 | 13F | Ascent Group, LLC | 18 160 | −6,48 | 110 | −9,17 | ||||
| 2025-08-07 | 13F | Sierra Ocean, Llc | 1 393 | 6,42 | 8 | 0,00 | ||||
| 2025-08-13 | 13F | Marshall Wace, Llp | 2 595 560 | 284,94 | 15 703 | 274,42 | ||||
| 2025-08-14 | 13F | Cubist Systematic Strategies, LLC | 88 031 | 10,96 | 533 | 7,91 | ||||
| 2025-07-30 | NP | APIE - ActivePassive International Equity ETF | 35 052 | 767,41 | 213 | 688,89 | ||||
| 2025-05-09 | 13F | GeoWealth Management, LLC | 0 | −100,00 | 0 | |||||
| 2025-07-28 | 13F | Axxcess Wealth Management, Llc | 15 090 | 0,00 | 91 | −2,15 | ||||
| 2025-08-14 | 13F | Fmr Llc | 113 168 | 40,72 | 685 | 36,80 | ||||
| 2025-05-12 | 13F | National Bank Of Canada /fi/ | 0 | −100,00 | 0 | |||||
| 2025-05-15 | 13F | Glenmede Trust Co Na | 11 819 | −17,52 | 74 | −21,51 | ||||
| 2025-08-13 | 13F | First Trust Advisors Lp | 56 920 | −16,07 | 344 | −18,29 | ||||
| 2025-08-07 | 13F | Acadian Asset Management Llc | 122 395 | −32,68 | 1 | −100,00 | ||||
| 2025-07-15 | 13F | Maseco Llp | 272 | 2 | ||||||
| 2025-08-06 | 13F | Valued Wealth Advisors LLC | 689 | 0,00 | 4 | 0,00 | ||||
| 2025-08-14 | 13F | Bnp Paribas Arbitrage, Sa | 466 398 | −16,65 | 2 822 | −18,94 | ||||
| 2025-08-14 | 13F | Stifel Financial Corp | 222 084 | −18,71 | 1 344 | −20,95 | ||||
| 2025-08-14 | 13F | State Street Corp | 776 151 | 732,82 | 4 771 | 724,01 | ||||
| 2025-08-12 | 13F | Franklin Resources Inc | 0 | −100,00 | 0 | |||||
| 2025-05-01 | 13F | Schechter Investment Advisors, LLC | 14 735 | −23,96 | 92 | −27,78 | ||||
| 2025-08-29 | NP | GAUAX - The Gabelli Utilities Fund Class A | 267 500 | −0,19 | 1 618 | −2,88 | ||||
| 2025-07-24 | 13F | Jfs Wealth Advisors, Llc | 925 | 0,00 | 6 | 0,00 | ||||
| 2025-08-14 | 13F | Two Sigma Advisers, Lp | 378 400 | 933,88 | 2 289 | 908,37 | ||||
| 2025-08-12 | 13F | Rhumbline Advisers | 88 781 | −39,41 | 537 | −41,05 | ||||
| 2025-08-14 | 13F | Goldman Sachs Group Inc | 1 694 970 | 82,63 | 10 255 | 77,65 | ||||
| 2025-08-07 | 13F | Allworth Financial LP | 1 455 | 31,67 | 9 | 33,33 | ||||
| 2025-08-14 | 13F | Barometer Capital Management Inc. | 67 016 | 29,33 | 405 | 25,78 | ||||
| 2025-08-07 | 13F | Mitsubishi UFJ Kokusai Asset Management Co., Ltd. | 27 243 | 67,45 | 165 | 62,38 | ||||
| 2025-07-28 | 13F | Harbour Investments, Inc. | 234 | 0,00 | 1 | 0,00 | ||||
| 2025-07-18 | 13F | Warren Street Wealth Advisors, LLC | 17 381 | 6,86 | 105 | 3,96 | ||||
| 2025-07-25 | 13F | Verdence Capital Advisors LLC | 10 903 | 2,59 | 66 | −1,52 | ||||
| 2025-08-15 | 13F | WealthCollab, LLC | 3 758 | 0,00 | 23 | −4,35 | ||||
| 2025-07-25 | 13F | RHS Financial, LLC | 24 224 | −5,61 | 147 | −8,18 | ||||
| 2025-07-17 | 13F | Greenleaf Trust | 0 | −100,00 | 0 | |||||
| 2025-03-26 | NP | TDVI - FT Vest Technology Dividend Target Income ETF | 1 272 | 27,07 | 9 | 50,00 | ||||
| 2025-05-22 | NP | TDIV - First Trust NASDAQ Technology Dividend Index Fund This fund is a listed as child fund of First Trust Advisors Lp and if that institution has disclosed ownership in this security, then these positions will not be double counted when calculating total shares and total value | 0 | −100,00 | 0 | −100,00 | ||||
| 2025-08-11 | 13F | United Capital Financial Advisers, Llc | 14 499 | −5,98 | 88 | −8,42 | ||||
| 2025-08-14 | 13F | Evergreen Capital Management Llc | 23 271 | 143 | ||||||
| 2025-08-11 | 13F | Brown Brothers Harriman & Co | 336 | 66,34 | 2 | −33,33 | ||||
| 2025-08-13 | 13F | Guggenheim Capital Llc | 112 096 | 13,83 | 678 | 10,78 | ||||
| 2025-07-25 | NP | DEMAX - Delaware Emerging Markets Fund Class A | 4 449 485 | 0,00 | 27 053 | −10,33 | ||||
| 2025-08-14 | 13F | Atomi Financial Group, Inc. | 29 194 | −2,36 | 177 | −4,86 | ||||
| 2025-08-28 | NP | GHTA - Goose Hollow Tactical Allocation ETF | 30 000 | 182 | ||||||
| 2025-08-08 | 13F | Pnc Financial Services Group, Inc. | 88 492 | 33,86 | 535 | 30,17 | ||||
| 2025-08-12 | 13F | Dimensional Fund Advisors Lp | 38 730 | 7,90 | 234 | 4,93 | ||||
| 2025-08-14 | 13F/A | Skopos Labs, Inc. | 8 066 | 806,29 | 49 | 860,00 | ||||
| 2025-07-24 | 13F | Ronald Blue Trust, Inc. | 15 561 | −9,21 | 94 | −11,32 | ||||
| 2025-05-15 | 13F | Aquatic Capital Management LLC | 0 | −100,00 | 0 | |||||
| 2025-04-14 | 13F | Clean Yield Group | 0 | −100,00 | 0 | |||||
| 2025-07-08 | 13F | Parallel Advisors, LLC | 29 385 | 7,86 | 178 | 4,73 | ||||
| 2025-08-26 | NP | SBHEX - Segall Bryant & Hamill Emerging Markets Fund Retail Class | 11 000 | 0,00 | 67 | −2,94 | ||||
| 2025-07-14 | 13F | UMA Financial Services, Inc. | 221 | −64,98 | 1 | −66,67 | ||||
| 2025-08-13 | 13F | Townsquare Capital Llc | 0 | −100,00 | 0 | |||||
| 2025-06-26 | 13F/A | Deutsche Bank Ag\ | 0 | −100,00 | 0 | |||||
| 2025-07-16 | 13F | Kathmere Capital Management, LLC | 22 401 | −5,48 | 136 | −8,16 | ||||
| 2025-07-21 | 13F | Qrg Capital Management, Inc. | 22 586 | −6,90 | 137 | −9,33 | ||||
| 2025-07-28 | 13F | Ritholtz Wealth Management | 334 599 | −5,31 | 2 024 | −7,87 | ||||
| 2025-08-06 | 13F | Fox Run Management, L.l.c. | 0 | −100,00 | 0 | |||||
| 2025-08-14 | 13F | Two Sigma Investments, Lp | 966 517 | 1 142,52 | 5 847 | 1 110,56 | ||||
| 2025-08-08 | 13F | SBI Securities Co., Ltd. | 3 533 | 4,56 | 21 | 0,00 | ||||
| 2025-07-15 | 13F | Public Employees Retirement System Of Ohio | 1 447 | −29,76 | 9 | −33,33 | ||||
| 2025-08-06 | 13F | True Wealth Design, LLC | 133 | −2,21 | 1 | |||||
| 2025-08-29 | NP | GCAEX - The Gabelli Equity Income Fund Class A | 20 000 | 0,00 | 121 | −2,42 | ||||
| 2025-08-13 | 13F | Northern Trust Corp | 297 940 | 1,29 | 1 803 | −1,48 | ||||
| 2025-08-14 | 13F | Mariner, LLC | 83 651 | −6,12 | 506 | −8,84 | ||||
| 2025-05-05 | 13F | Transce3nd, LLC | 0 | −100,00 | 0 | |||||
| 2025-07-21 | 13F | Credential Securities Inc. | 207 | 0,00 | 1 | 0,00 | ||||
| 2025-07-30 | 13F | Ethic Inc. | 74 871 | −2,87 | 425 | −12,22 | ||||
| 2025-08-11 | 13F | TD Waterhouse Canada Inc. | 4 000 | 0,00 | 25 | −4,00 | ||||
| 2025-07-11 | 13F | Farther Finance Advisors, LLC | 2 795 | 302,74 | 17 | 300,00 | ||||
| 2025-08-14 | 13F | Ieq Capital, Llc | 41 181 | 189,90 | 249 | 182,95 | ||||
| 2025-08-11 | 13F | Citigroup Inc | 287 120 | 8,25 | 1 737 | 5,34 | ||||
| 2025-07-29 | NP | RBB FUND, INC. - Aquarius International Fund | 28 289 | 36,12 | 172 | 22,14 | ||||
| 2025-05-14 | 13F | Boston Private Wealth Llc | 0 | −100,00 | 0 | |||||
| 2025-08-07 | 13F | Hennion & Walsh Asset Management, Inc. | 0 | −100,00 | 0 | |||||
| 2025-08-13 | 13F | Quadrature Capital Ltd | 61 346 | 415,51 | 371 | 437,68 |